The 15-Second Uber Driver Gamble
Upfront Tip
Weekly. Free. Straight from the driver's seat.
Imagine playing high/low with a deck of cards.
I deal you the nine of clubs. You have 15 seconds to decide: keep the card and end the game, or discard it forever and ask for another. You can keep rejecting cards, but eventually the deck ends. If you never choose one, you leave with nothing. Your goal is to stop on the highest card you can.
That is the game Uber drivers play every time we turn the app on. Except the game is worse than that, in two ways.
First, with an ordinary deck, at least you know the odds. There are 52 cards. You know the range of possible outcomes and how many opportunities remain.
Uber drivers know none of that. We do not know which card (trip offer) will be the best or worst. We do not know how many trip offers remain or when the next one will arrive. From the driver’s perspective, Uber’s trip offer deck of cards is open-ended and continually reshuffled by location, rider demand, driver supply, traffic, and pricing.
Second, Uber’s algorithm decides what cards go in the deck and which player (driver) gets the ride.
In Syracuse, each trip offer appears for roughly 15-seconds. I get to see the flat rate I’ll get paid, pickup and drop-off information, passenger rating, and sometimes a collection of labels. I can either accept or decline the trip. Then another trip will appear within seconds or minutes, depending on how busy it is. Accepting means the trip is mine. Declining means I’m still available, but the next offer could be better, worse, or never arrive.
Uber cannot predict the future, but it can see the table: the riders waiting, nearby drivers, current prices, recent demand, and the other forces shaping the marketplace. Its matching system ultimately determines which offer to show each driver. Whereas the driver sees one card at a time.
15-seconds to decide: is this trip good enough, or is it worth gambling on the next one?
To understand the deck Uber was dealing me, I recorded 223 consecutive trip offers over 5 hours in Syracuse, New York, on a slow Wednesday afternoon. I declined 222 and completed one trip so Uber would register the online session. I logged every offer in a spreadsheet, calculated its estimated profit, and modeled how drivers could play the same hand.
My central finding is simple: the average estimated profit rate for the top 25% of trips was $24.21 per active hour, almost double that of the bottom 25% at $12.06.
That is the main job of being an Uber driver. We are not merely transporting passengers safely. We are making repeated, time-limited business decisions under uncertainty while the platform can see far more of the table than we can.
By the end of this report, I hope to help other drivers understand their own deck and decide which cards are worth keeping.
First - Play an Uber Game
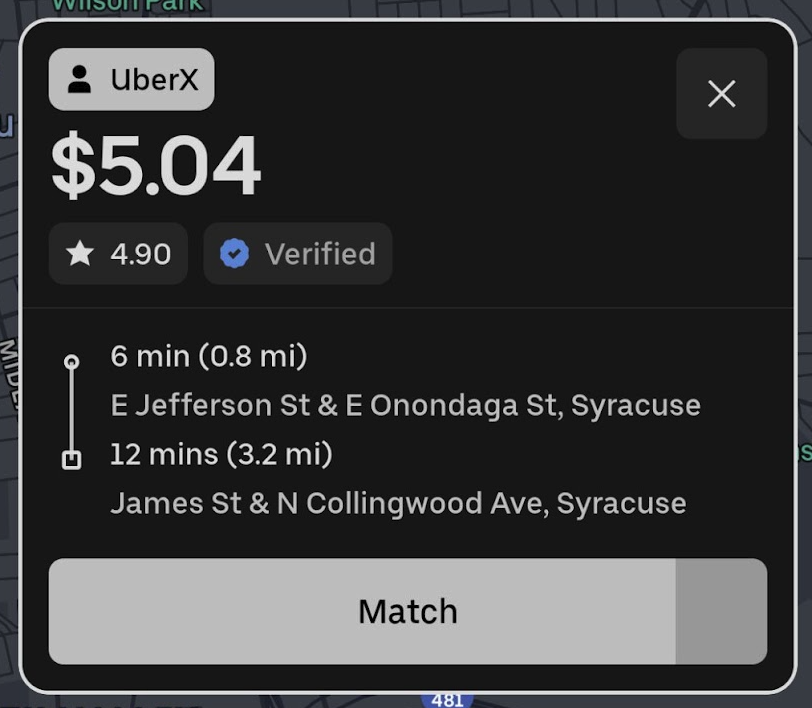
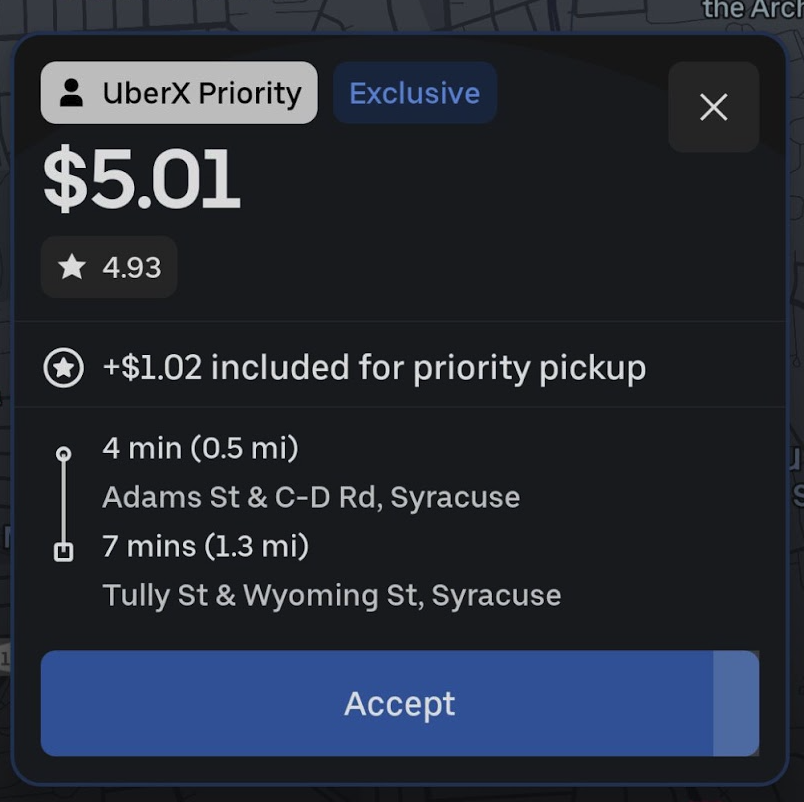
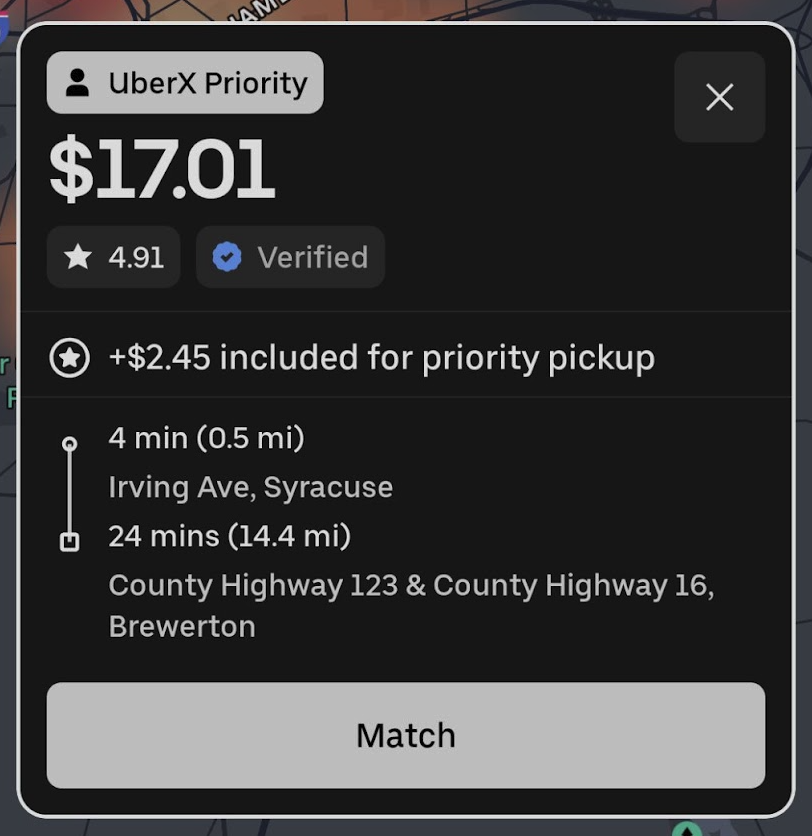
Which Uber trip do you accept?
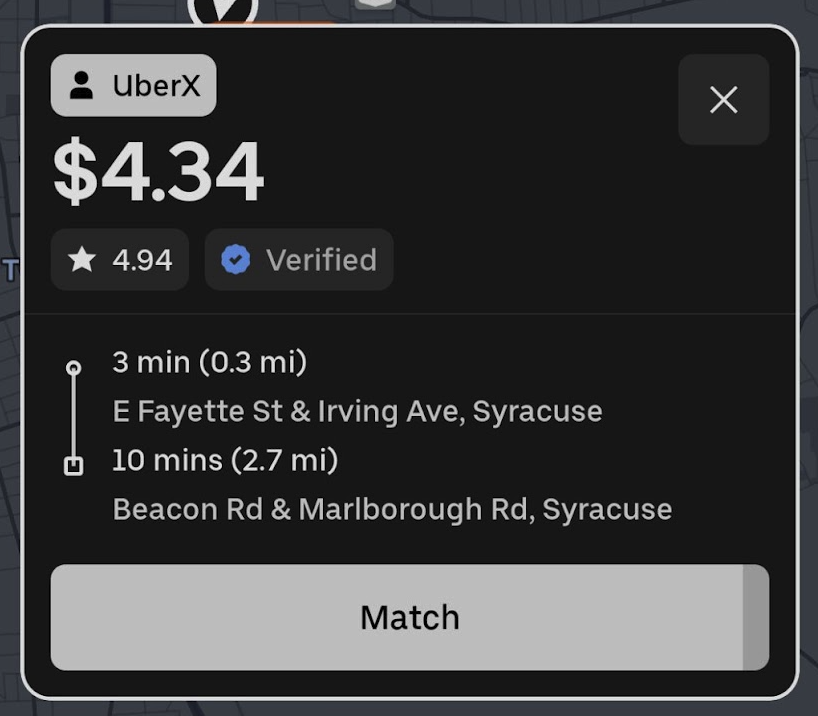
$4.34 — 4:15 p.m., 3-min (.3 mi) pickup, 10-min (2.7 mi) trip, Verified
$5.04 — 4:17 p.m., 6-min (.8 mi) pickup, 12-min (3.2 mi) trip, Verified
$5.01 — 4:17 p.m., 4-min (.5 mi) pickup, 7-min (1.3 mi) trip, Priority and Exclusive
$17.01 — 4:17 p.m., 4-min (.5 mi) pickup, 24-min (14.4 mi) trip, Priority and Verified
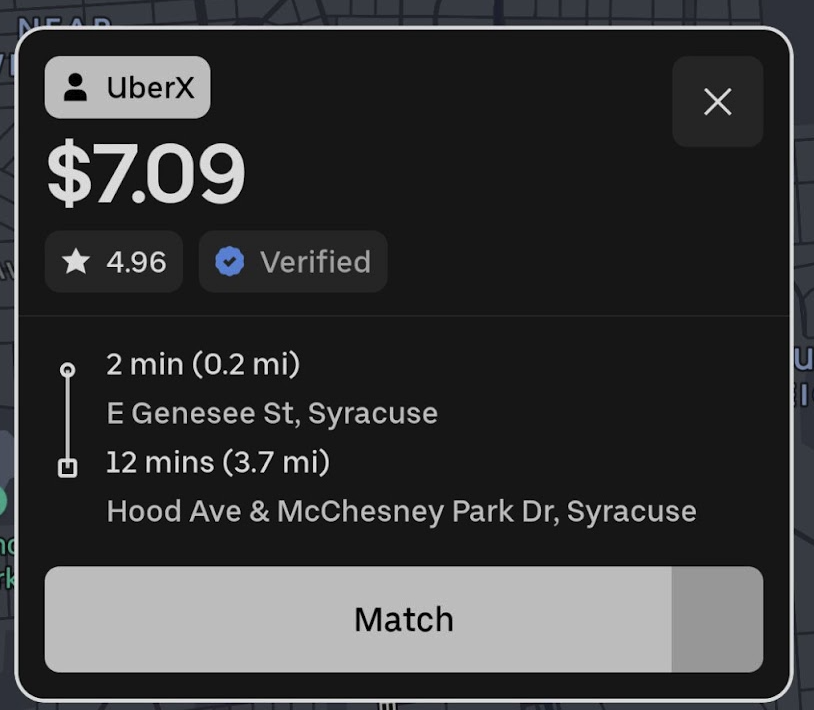
$7.09 — 4:18 p.m., 2-min (.2 mi) pickup, 12-min (3.7 mi) trip, Verified
With perfect hindsight, trip 4 (195 in the dataset) was the best choice by both total estimated profit and profit per active hour.
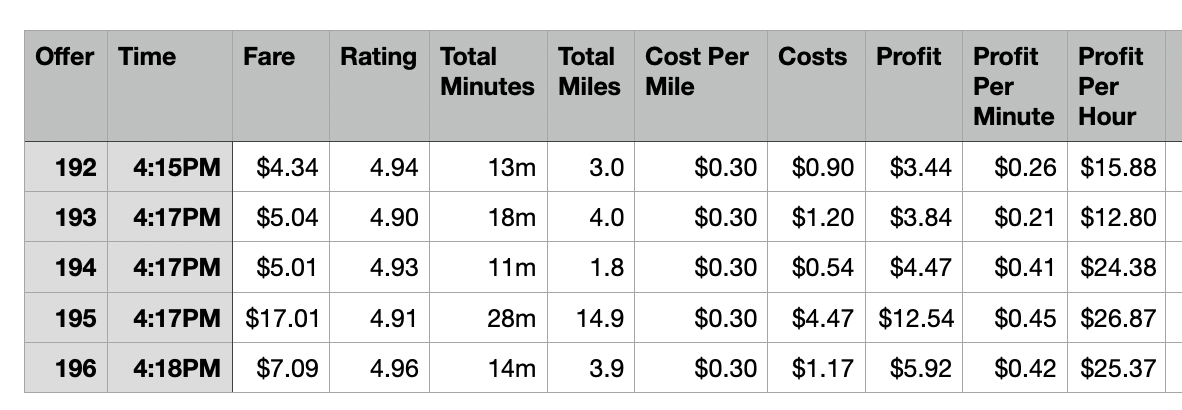
But a real Uber driver could not know that trip 4 was coming. Trip 3 was already very good, and it was Exclusive, meaning acceptance would automatically assign it to the driver. Trip 4 paid more, but it was a Trip Radar trip sent to an unknown number of drivers, and therefore was not guaranteed.
Declining trip 3 to wait for trip 4 is a gamble. Accepting trip 3 would have been rational too. Worse, declining trip 4 and seeing a lower-paying trip 5 can be demoralizing.
This is why hindsight rankings do not completely solve the driver’s problem. The hard question is not “Which trip was best?” It is “When should an Uber driver stop waiting and say yes?”
My Uber Experiment
Download the .csv file of all 223 trips.
The dataset contains 223 trip offers numbered consecutively from 1 through 223. They appeared from 12:49 p.m. to 5:48 p.m., an observation window of 299 minutes (just under five hours), on Wednesday, August 5th, 2026, in Syracuse, New York.
The dataset includes:
Upfront driver fare
Passenger rating
Pickup minutes and miles
Passenger-trip minutes and miles
Product type
Exclusive status
VIP, Rarely Cancels, and Verified labels
Multi-Stop status
Airport and priority-queue indicators
The 5% Pro payment
Priority Pickup and Flash payments
Total time, mileage, estimated cost, estimated profit, and profit per hour
The trip mix was:
202 - UberX
14 - UberX Priority
4 - Comfort
2 - UberX Reservation
1 - Comfort Reservation
There were also 66 Exclusive trips, 127 Verified passenger labels, 35 Rarely Cancels labels, 26 VIP labels, 9 Multi-Stop trips, 12 Airport trips, 13 Priority Pickup trips, and six Flash incentive trips.
NOTE: It was a slow afternoon. There weren’t any Surges on the map, and none of the 223 trip offers displayed additional Surge pricing.
These counts describe trip offers, not necessarily unique passenger requests. Several trips appear similar enough to be possible reoffers of the same passenger trip request, sometimes with a changed pickup estimate, price, passenger rating, or Exclusive status. Without a unique trip-request identifier, I cannot prove which offers were duplicates. That means the sample is best interpreted as 223 decisions presented to a driver, not 223 independent passengers.
Data Quality
I think the basic data quality was good. I didn’t miss anything. The trip sequence was complete; every row had a fare, rating, pickup duration, trip duration, and drop-off mileage, and the source calculations for time, cost, profit, and hourly profit reconciled.
One material field was missing: Offer 108 did not contain pickup mileage because it was a reservation for later in the day.
Trip 216 was completed only to ensure Uber registered the online session. However, this analysis uses only the information displayed when each trip was offered. I did not add completed-trip results, so the dataset does not measure actual tips, rider cancellations, traffic overruns, destination changes, final fare adjustments, or post-trip safety outcomes.
How I Calculated Profit
The working assumption was my estimated direct variable vehicle cost of $0.30 per mile. That’s my depreciation, electricity (fuel), and maintenance on my 2023 Tesla Y. But it’s not a complete accounting of my Uber business. It excludes or may not fully capture:
Insurance
Registration
Financing costs
Cleaning
Phone and data service
Taxes
Unpaid administrative time
Accident and repair risk
The cost of owning a vehicle while it is parked
The profit calculation for each trip offer:
Estimated profit = upfront fare − ($0.30 × total miles)
Profit per active hour = (estimated profit ÷ total minutes) × 60
Pickup time and pickup miles are counted because I’m already working and operating the vehicle before the passenger enters the car.
Tips are excluded because none were observed. This makes the comparisons cleaner, but it also means the analysis cannot measure whether passenger rating, airport travel, or conversation quality changes tipping.
The full 223-trip offer dataset had an average fare of $8.07, a median fare of $7.08, an average estimated duration of 20.1 minutes, and an average total mileage of 7.98 miles. If all the offer-level work were pooled together, the time-weighted result would be approximately $16.94 per active hour after the $0.30-per-mile cost.
That is not a real shift result because a driver cannot accept overlapping offers. It describes the overall quality of the offer pool.
Findings
Choosing the right trips can approximately double my active earnings.
I ranked the 220 live, non-reservation trips by estimated profit per active hour. When each trip’s calculated hourly rate was weighted equally, the top 25% averaged $24.21 per active hour, and the bottom 25% averaged $12.06 per active hour.
When all minutes and profits within each quarter are pooled for a more rigorous time-weighted comparison, the top 25% produced $23.67 per active hour, and the bottom quarter produced $11.90 per active hour. The ratio is almost exactly two to one.
This does not mean one driver could accept every top-quarter offer while another accepted every bottom-quarter offer. Many offers overlap. It does demonstrate that apparently similar Uber work was being offered at dramatically different economic values.
For context, the 2026 minimum wage in Syracuse and the remainder of New York State is $16 per hour. That does not mean Uber is legally required to pay this dataset’s contractor offers at the employee minimum wage, and the two figures are not identical accounting concepts. It is an opportunity-cost comparison: a worker can compare gig driving with conventional hourly employment. The bottom-quarter offers fell well below that benchmark even before accounting for fixed business costs and taxes.
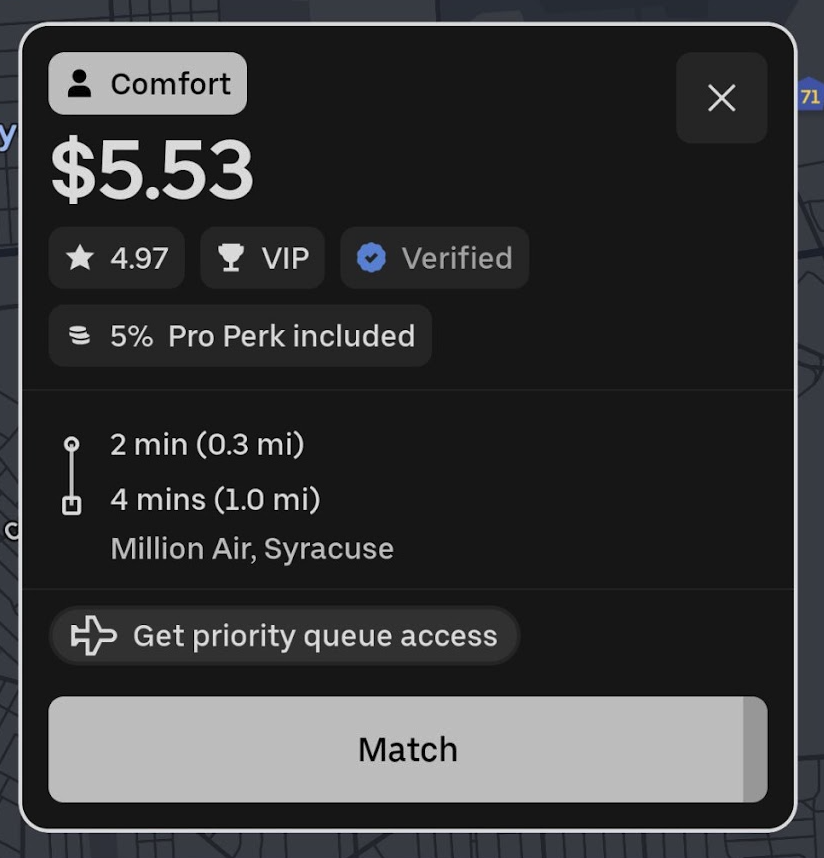
The highest hourly-rate offer was trip 49: a short 6-minute Comfort trip from the Syracuse airport terminal to the private jet terminal paying $5.53. After $0.39 in mileage cost, it produced only $5.14 of total profit, equivalent to $51.40 per active hour.
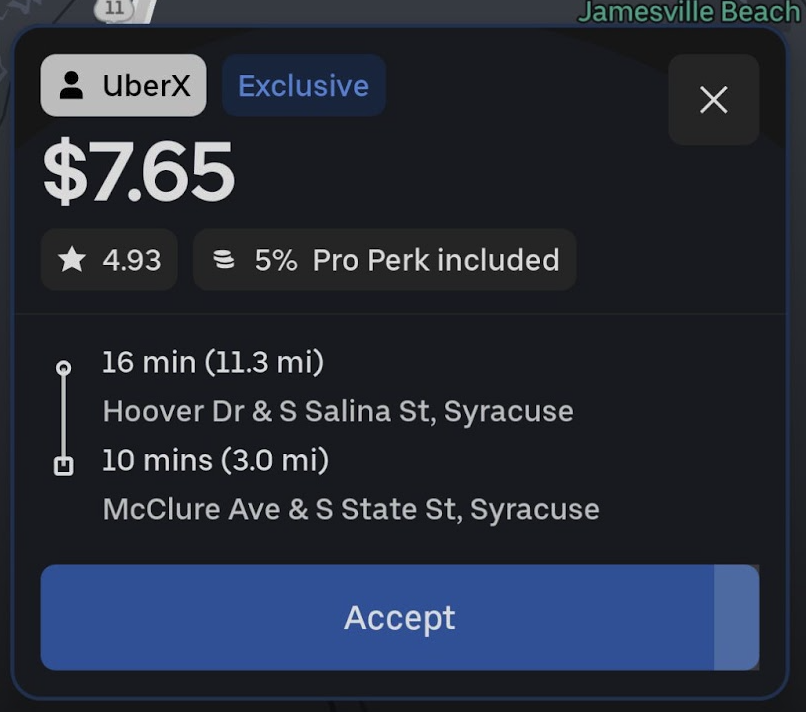
The lowest was trip 7: $7.65 for 26 minutes and a total of 14.3 miles. It produced $3.36 of profit, or $7.75 per active hour.
This exposes another important distinction: the trip with the highest hourly rate is not necessarily the trip that puts the most dollars in the driver’s pocket.
2. Active hourly profit is not the same as shift earnings.
Drivers often compare trips in terms of dollars per mile or dollars per active hour. Those are useful measures of trip quality, but neither counts the time spent parked and declining.
A driver can truthfully say, “My accepted trips paid $30 an hour,” while earning far less across 5 hours online if the remaining time was spent parked and declining.
Some drivers reduce that idle time by multi-apping: running Uber, Lyft, DoorDash, and other gig apps simultaneously, then accepting the best available offer. I did not multi-app in this experiment. All utilization and online-hour estimates in this report reflect Uber alone.
To demonstrate this, I built a simple average-arrival model. It ranks the 220 live, non-reservation trips by profit per active hour. For each hindsight selection level, it estimates how often a qualifying trip would arrive, the average duration of those trips, the resulting utilization, and five-hour profit. These percentages describe the share of recorded trips that qualify, not the acceptance rate displayed in Uber’s app.
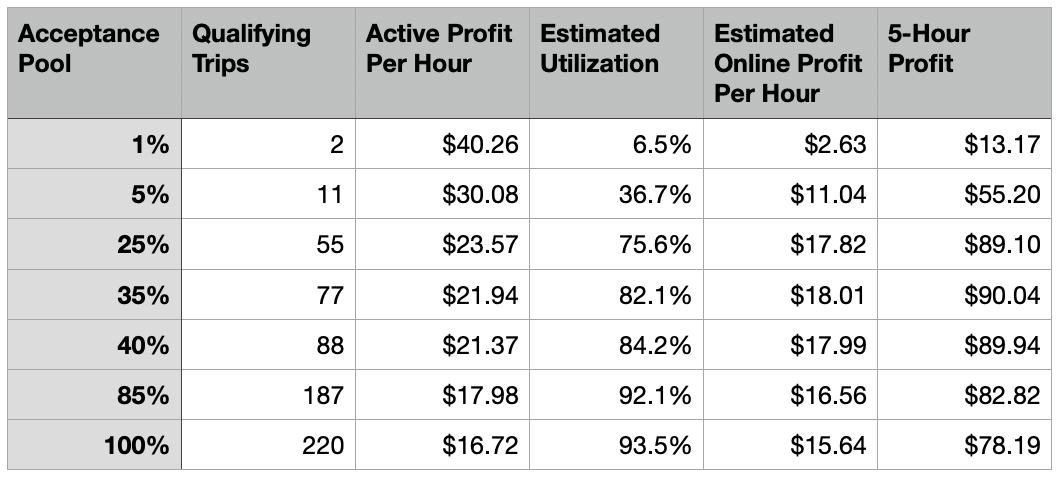
The modeled peak appears when roughly 35% of trips qualify, but the curve is broad: selecting approximately the top 25%-40% performs similarly. This is not evidence that drivers should maintain a 35% acceptance rate in Uber’s app.
Extreme cherry-picking preserves trip quality but destroys utilization.
Accepting nearly everything preserves utilization but admits too many weak trips.
There are also two ways to define the “top 1%.” Ranking by hourly efficiency selects Offers 49 and 13. Ranking by total trip profit selects Offers 217 and 222. The latter pair would produce approximately $30.11 over 75 active minutes if both were guaranteed and completed, but only $6.02 per online hour when spread across a five-hour window.
The best trip, the biggest trip, and the best five-hour strategy are three different questions.
Why the acceptance model is not a promise.
The model assumes the recorded offer-arrival frequency repeats and that accepting a trip does not change future supply. Reality is messier. Accepting a trip changes the driver’s location, removes offers that would otherwise have been seen, and may change what Uber sends next. The model describes the tradeoff between quality and utilization; it does not guarantee a particular wage.
3. A simple threshold nearly matched perfect hindsight.
I also replayed the offers in chronological order. When a trip was accepted, the driver became unavailable for its full estimated pickup and passenger duration. The next eligible offer was the first one arriving after that time.
Under those fixed-stream rules, and excluding the unusual trip 108 reservation, the maximum-profit sequence selected 14 offers:
8, 19, 40, 46, 57, 82, 109, 128, 143, 161, 189, 216, 218, and 221
That sequence produced:
$153.58 in upfront fares
134.2 total miles
$40.26 in direct mileage costs
$113.32 in estimated profit
291 active minutes
$23.36 per active hour
$20.42 per elapsed clock hour from the first available decision through completion
The final trip ended at 6:22 p.m., after the last offer was recorded. Requiring every trip to finish by 5:48 reduced the optimum to $97.69.
Perfect hindsight is impossible in practice. More useful is what happened with a simple decision rule: accept the next available offer whenever it provided at least $18 of estimated profit per active hour.
That rule produced $105.87, approximately 93% of the $113.32 hindsight optimum under the same fixed-stream assumptions.
This may be the most useful strategic result in the entire experiment: A driver does not need to identify the perfect trip. A consistent minimum standard can capture most of the available value while avoiding both terrible trips and endless waiting.
At a $0.30-per-mile cost and an $18-per-hour active-profit target, the decision formula becomes unusually simple: Required fare = $0.30 × total miles + $0.30 × total minutes
A 20-minute, 10-mile offer therefore needs to pay at least $9: ($0.30 × 10 miles) + ($0.30 × 20 minutes) = $3 + $6 = $9
A driver with a different cost or income target should change the formula: Required fare = vehicle cost per mile × total miles + desired hourly profit × total minutes ÷ 60
4. Pickup time is where many offers become unprofitable.
The strongest practical pattern was pickup time.
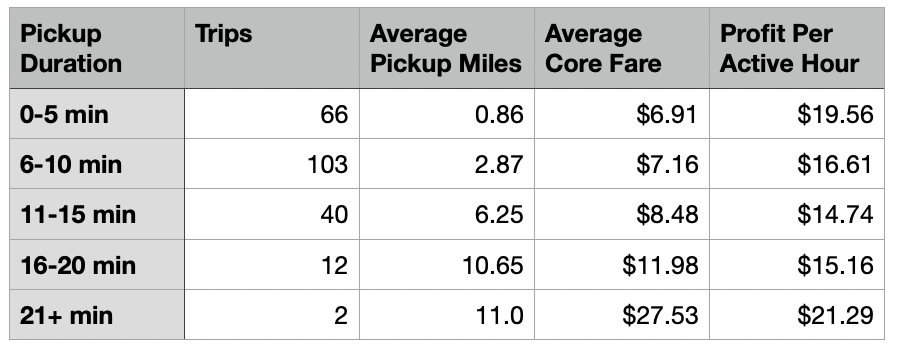
The final group contains only two unusual, high-dollar offers and should not be treated as evidence that extremely long pickups are generally good.
The middle of the table tells the story. Uber did offer more money as pickup distance increased, but the additional fare generally did not preserve the driver’s hourly profitability.
Offers with pickups under one mile produced $20.27 per active hour on a time-weighted basis. Offers with pickups over five miles produced $14.94.
Uber says its upfront fares account for pickup distance and that, in its newer U.S. upfront-fare system, the request with the longest pickup in an area may receive a higher fare. This dataset is consistent with some additional long-pickup compensation—but not enough to make most distant pickups attractive after time and mileage.
Is there a specific long-pickup pricing threshold?
I coul a clean universal breakpoint at five, seven, nine, or ten minutes where a distinct long-pickup payment suddenly appeared. A seven-minute pickup remains a useful practical warning line for this driver in Syracuse, but it is not a demonstrated Uber pricing threshold.
The better rule is not “never accept more than seven minutes.” It is:
Treat a long pickup as a major cost and accept it only when the fare clearly compensates for both the time and mileage.
5. The fare looks like a formula, but not a public rate card.
Uber states that upfront fares can incorporate pickup time, trip time, and mileage, demand, traffic, destination conditions, surge, tolls, and other marketplace factors. Unlike with a traditional rate card, a driver generally cannot reproduce the offer from a published per-mile and per-minute schedule.
I modeled the “core fare” after removing the separately visible 5% Pro, Priority Pickup, and Flash Incentive amounts. I excluded trip 108 because of its missing pickup mileage; a straightforward regression explained approximately 87.3% of observed core-fare variation, with an average prediction error of about $1.18.
The approximate fitted equation was: Core fare ≈ $0.75 + $0.424 per drop-off mile + $0.222 per drop-off minute + $0.263 per pickup mile + $0.128 per pickup minute + category and time adjustments
These coefficients are descriptive, not Uber’s official rates and not proof of causation. Pickup miles and minutes are also correlated, as are trip miles and minutes.
Still, the difference is revealing. In the fitted model:
A pickup mile carried approximately 62% of the coefficient of a passenger mile.
A pickup minute carried approximately 58% of the coefficient of a passenger-trip minute.
That helps explain the pickup penalty: pickup work appears to be valued, but less heavily than passenger-carrying work.
The model also demonstrates what cannot be learned from this dataset. Because the rider’s price is missing, I cannot calculate Uber’s take rate, determine how much Uber earned on an offer, or prove that a particular high fare was attributable to rider surge pricing.
6. Badges did not predict better pay.
The offer screen contains many labels, but most did not have meaningful predictive value for upfront profitability. The following are time-weighted results using the $0.30-per-mile cost:
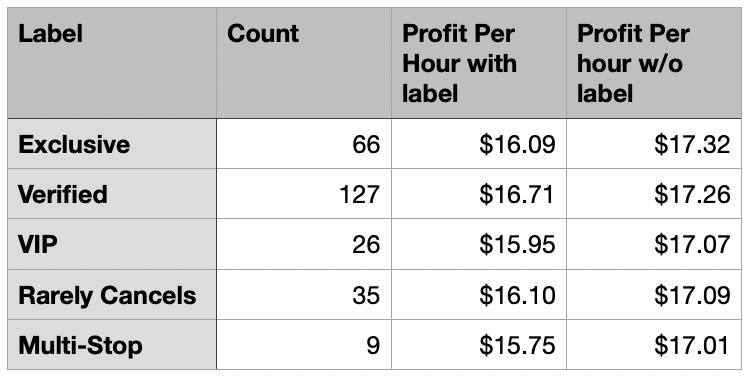
These small differences do not prove that a badge causes lower pay. The groups differ in mileage, duration, location, and trip mix. The important finding is that none of these labels provided a reliable positive earnings signal.
Adding Exclusive, VIP, Rarely Cancels, Verified, and passenger rating to the fare model improved its fit only from 87.33% to 87.64%. That improvement is tiny, and the more complicated model performed worse under a complexity-adjusted comparison.
Badges also had essentially zero correlation with passenger rating:
VIP and rating: 0.005
Rarely Cancels and rating: −0.006
Verified and rating: −0.007
Total badge count and rating: −0.005
In plain English, badged passengers were not meaningfully higher-rated passengers in this sample.
Does passenger rating matter?
Passenger rating had almost no relationship with fare or upfront profit. The correlation between rating and profit per active hour was only 0.032.
That does not mean rating is useless. A driver may use it as a personal safety, behavior, or tipping heuristic. But this offer-only dataset cannot test those outcomes.
My separate driving research suggests that riders rated 4.95 or higher tip more often. That hypothesis should remain separate from this experiment until completed-trip and tip data can be used to test it directly. Applying a rigid 4.95 cutoff here would have rejected some highly profitable offers, including Offer 204: a 4.92-rated rider attached to an offer worth approximately $35.14 per active hour before tips.
Rating should therefore be a secondary judgment, not a substitute for the trip’s economics.
7. Exclusive provides certainty, not a profitability premium.
An Exclusive trip request is offered only to that driver for a limited time. If accepted, it is automatically assigned. A Trip Radar request is sent to multiple drivers, and tapping “Match” does not guarantee assignment. Uber confirms this distinction in its own documentation.
Exclusive offers were not more profitable on average in this sample. But that does not make the label worthless. It changes the nature of the decision.
An excellent matched offer may be better than an excellent Exclusive offer, but the driver may never be assigned to the trip. Certainty has economic value even when it does not appear in the fare.
This is why the five-trip offer test matters. Trip 194 was a guaranteed, highly profitable Exclusive. Trip 195 was better, but not guaranteed. The correct decision depends partly on risk tolerance, not just arithmetic.
8. Some trip categories looked promising, but sample size matters.
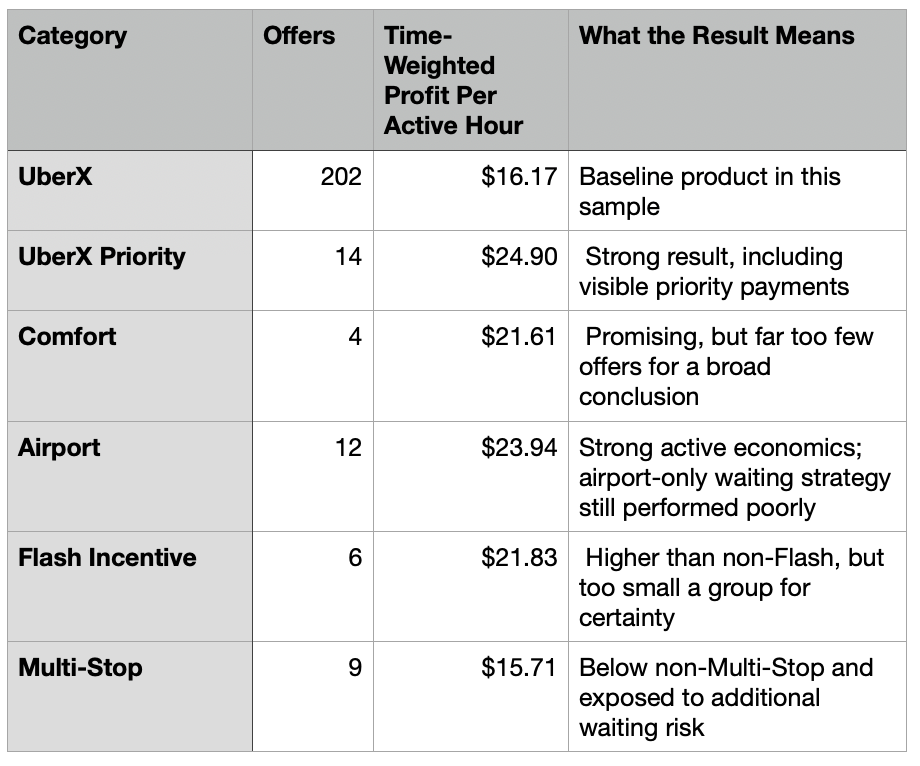
Priority and airport offers were among the strongest categories. However, “airport trips pay well” is not the same as “waiting at the airport pays well.”
Only taking live airport offers produced approximately $22.78 per active hour in the chronological simulation, but only about $8.99 per observed shift hour because qualifying offers were infrequent. Airport trips are an opportunity to recognize, not necessarily a place to wait indefinitely.
Multi-stop waiting
The app showed a $0.26 per-minute waiting charge after two free minutes. That is $15.60 per paid waiting hour, but the 2 unpaid minutes lower the effective rate:
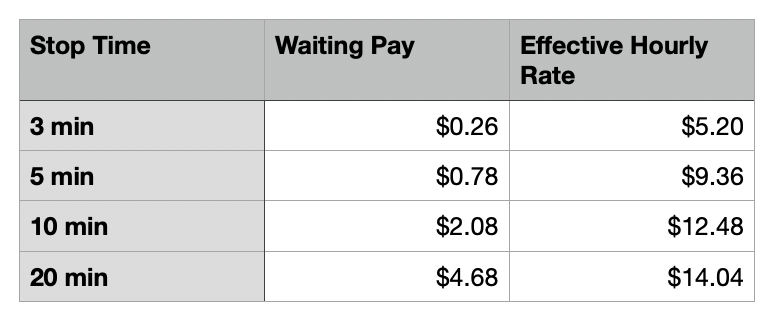
Multi-stop trips are not automatically losses. A strong upfront fare can compensate. But they transfer an unknown amount of waiting risk to the driver, so they should require a higher margin of safety.
9. Some common driver strategies are incomplete.
I tested three common strategies.
“Only take long trips”
Trips with at least 10 passenger miles produced a respectable $19.79 per active hour. But accepting the first available qualifying long trip produced only $10.99 per observed shift hour because there were just 16 qualifying offers and the driver spent substantial time waiting.
Trips lasting at least 30 minutes performed worse: $16.85 per active hour across the qualifying pool and approximately $10.47 per observed shift hour in the take-first replay.
Long trips also create destination and return-mile risk that the offer screen does not quantify. A trip to a productive neighboring market may be useful. A trip to a low-demand rural area may require an unpaid return.
“Only take airport trips”
Airport trips were high-quality while active but too rare to fill the shift. A driver should treat them as favorable opportunities, not proof that an airport parking lot is the best workplace.
“Only take trips paying at least $1 per total mile”
This was the strongest of the three simple filters. There were 128 such trips. Accepting the first qualifying trip whenever available produced:
13 trips
$112.64 gross
80.6 miles
$88.46 estimated profit
$21.75 per active hour
$17.75 per observed shift hour
That is useful, but $1 per mile still ignores time. A slow $1-per-mile trip in traffic can be worse than a lower-per-mile highway trip. Drivers need both miles and minutes.
10. Vehicle cost can completely change the correct choices.
The $0.30-per-mile assumption based on my Tesla is plausible for a highly efficient vehicle when measuring direct variable costs, but it is not universal.
A driver with an inexpensive, paid-off high-mileage hybrid or efficient electric vehicle can rationally accept some longer trips that an owner of a high-depreciation SUV should reject. A driver’s minimum fare should rise with the actual cost of operating that particular vehicle.
In the fixed-stream perfect-hindsight simulation:
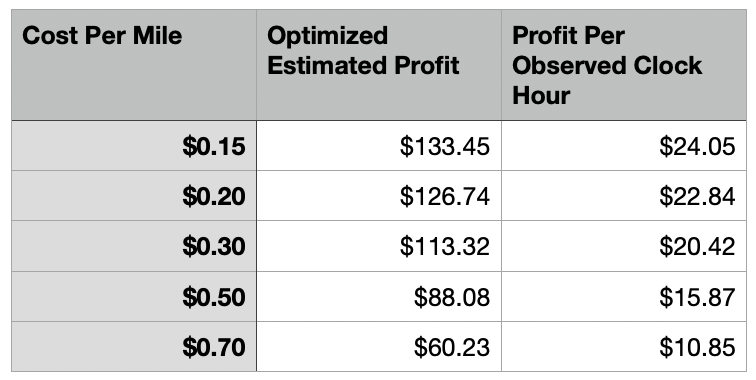
The IRS business mileage rate for July through December 2026 is 76 cents per mile. That figure is a tax-and-reimbursement benchmark that encompasses more than just immediate energy and maintenance; it should not be treated as every driver’s literal marginal cost. It is nevertheless a useful full-cost stress test. At 76 cents per mile, 20 of the 223 offers became negative before assigning any value to the driver’s time.
There is no universal “good Uber trip” independent of the car doing the work.
And of course, larger, more expensive vehicles qualify for premium-tier Uber trip offers like Uber XL or Uber Black.
The 5% Pro benefit: useful bonus or acceptance trap?
The first 98 trips offered an additional 5% Pro Perk amount. But after declining all those trips in a row, my trip acceptance rate fell below 25%, and I lost my Uber Driver Gold status and the 5% bonus.
Those displayed 5% Pro Perk amounts totaled $38.36, averaging approximately $0.39 per trip offer. Uber describes the Pro Perk as 5% more on eligible trip fares, while noting that eligibility, tiers, and requirements can vary. Uber’s current Pro description
Five percent is real money. But a driver should compare it with the cost of the marginal trips required to maintain eligibility. One bad distant pickup can erase the bonuses from several good trips.
The correct conclusion is not “never pursue Uber’s pro staus” or “always maintain 25%.” It is: Maintain the required acceptance rate only when the additional trips are already close to your normal profitability standard.
If earning the benefit requires accepting clearly inferior trips, the bonus can become a discount on bad work rather than a genuine raise.
There is also an important denominator problem. Uber describes acceptance rate as the percentage of Exclusive requests accepted within the last 100 Exclusive requests. This dataset includes Exclusive and non-Exclusive offers and does not include the driver’s full pre-session rolling history. Therefore, accepting 25% of all 223 rows is not necessarily the same as showing a 25% acceptance rate in the app. Uber’s Driver App explanation
The reservation that does not belong with the others.
Trip 108 was a $48.01 Comfort Reservation displayed at 3:07 p.m. for a scheduled 4:50 p.m. pickup—103 minutes later.
If evaluated only based on its listed 35-minute pickup estimate and 55-minute passenger trip, it appeared to generate $24.93 per active hour after the $0.30 mileage cost.
If it effectively prevented other work from 3:07 until the scheduled trip ended, its calendar-time return would fall to approximately $14.20 per hour. The precise reservation rules and the extent of interim work are not included in the dataset.
Trip 108 also lacked pickup mileage because I don’t know where I’ll be in the city when Uber sends me to the airport for the pickup. For those reasons, it was excluded from the main live-offer and strategy comparisons.
This is a broader lesson: reservations must be evaluated against the time they control, not merely the minutes displayed as driving time.
Is the Uber offer screen informing drivers or manipulating them?
The data can show the structure of the decision. It cannot prove Uber’s intent.
The offer screen undeniably provides useful information. Uber’s move to upfront fares gave drivers fare, time, distance, and destination information that many markets previously lacked. Uber describes this as increased transparency.
But the screen does not display the driver’s business results. It generally does not tell the driver:
Estimated profit after the driver’s own vehicle cost
Profit per active hour
Expected profit per online hour
Possible unpaid return mileage
The economic effect of a multi-stop wait
Whether a visually prominent badge has any financial value
How the current offer compares with recent nearby offers
The probability that a better offer will arrive after a decline
The screen also forces urgency. In my experience, the offer rings for approximately 15-seconds whether the vehicle is parked or moving. That is not enough time to perform a full cost-and-time calculation safely while driving.
Uber has already acknowledged that drivers want easier comparisons. In 2026, the company announced pilots that showed estimated earnings per distance or per active time for requests in selected markets. That is a useful step, but a gross earnings badge still does not account for the driver’s vehicle costs.
My conclusion is more precise than saying the screen is simply a trick: The Uber offer screen is a form of strategic choice architecture. It presents enough information to invite acceptance, but not enough information to calculate profit without additional effort.
That asymmetry benefits the party with more data. Uber knows far more about current demand, driver supply, recent declines, matching probability, and likely future offers than the driver making the ten-second decision.
What is universal and what is specific to Syracuse?
Findings that should travel across markets
Pickup time and mileage are real costs.
Revenue per mile alone is incomplete because time also has value.
Profit per active hour and profit per online hour answer different questions.
Extreme selectivity can destroy utilization.
High acceptance can preserve utilization while lowering trip quality.
Badges should not be assumed to represent additional pay.
Reservations must be judged by calendar time controlled.
Multi-stop trips contain uncertain waiting risk.
A vehicle’s cost changes which offers are rational.
Drivers make an optimal-stopping decision without knowing the next offer.
Findings that should remain local or provisional
The exact dollar amounts
The apparent 25%–40% acceptance plateau
The practical seven-minute pickup warning
Airport and Priority profitability
The fitted fare coefficients
The value of the 5% Pro Perk payment
Offer frequency and utilization
Neighborhood, traffic, and time-of-day effects
This was one slow Wednesday afternoon in Syracuse. It is not a national random sample. The experiment should be repeated in other cities, at other times, in different weather, and during high-demand events.
How drivers can run this experiment in their own market.
The purpose of this project is not to apply my Syracuse data to every driver in America. It is to show drivers how to discover their own.
Your car is different. Your city is different. The neighborhoods and hours you drive are different. The trip offers you receive may also be different. A useful rule for Syracuse on a slow Wednesday afternoon may be completely wrong during a Saturday night surge in Chicago for an Uber Black SUV driver.
Fortunately, drivers do not need to collect 223 offers or build a complicated statistical model before learning something useful.
How many offers should a driver collect?
One hundred consecutive offers is a practical minimum because it creates groups large enough to compare. The driver can divide the sample into four groups of 25, five groups of 20, or ten groups of 10, and begin to see where trip quality changes.
However, 100 offers do not automatically prove that Comfort, Airport, Multi-Stop, or another uncommon category is better. For any individual category, I would want at least 20 examples before treating the average as useful, and preferably 30 or more before changing a strategy based on it. Fewer than 10 examples should be considered anecdotal.
The goal is not necessarily to stay online for five hours. The goal is to collect enough offers to represent the market being studied. A busy market may generate 100 offers quickly. A slower market may require multiple sessions.
Decide what question the test is answering.
There are two related experiments, and drivers should not confuse them.
Experiment A: What is Uber offering in this market?
Go online for a dedicated observation period and allow offers to pass without completing trips. This preserves the sequence and reveals what continues to arrive after each decline.
This method is the closest match to my 223-offer experiment, but it has costs. The driver earns nothing during the observation period, and the declines may affect the acceptance rate and any associated benefits.
Maybe earn money on a different app while you collect the data.
Experiment B: Which offers work in my actual business?
Capture offers during normal driving, accept trips according to the current strategy, and later add the completed-trip results: actual duration, mileage, waiting, fare adjustments, tips, destination, return mileage, and time until the next trip.
This method yields more accurate real-world profit data, but it cannot reveal every offer that would have appeared while the driver was busy. It measures the strategy actually driven, not the complete market offer stream.
The strongest personal study uses both:
A 100-offer observation test to understand the local offer pool.
Several normal shifts to test whether the chosen thresholds produce the expected results.
Sample different parts of the market deliberately.
Driving randomly around a city can reveal variety, but a simple structure makes the results easier to interpret.
Choose three to five types of locations, such as:
Downtown or the central business district
Airport
University, hospital, or major employment center
Dense commercial or residential neighborhood
Outer suburb or lower-density edge of the market
Aim for at least 20 offers from each location type if neighborhood comparisons are important. Record the location as a general zone, not a passenger’s exact address.
For a more controlled test, travel between zones while offline, park safely, and collect offers for a fixed block of time in each zone. That keeps the driver’s position relatively stable and prevents changing pickup estimates from becoming the main difference between observations.
If driving while collecting is part of the experiment, use automatic capture. Do not touch the phone, study an offer, or perform calculations while the car is moving.
Also record the conditions:
Day of week
Time of day
Weather
Visible surge
Major events
Traffic conditions
Approximate number of drivers at airport queues, if relevant
A single 100-offer test describes one market period. A more reliable personal profile would repeat the test during at least two important days and times. For example, a slow weekday afternoon and a busy Friday or Saturday night.
Capture every offer in sequence.
I used a screen recording of my phone. I also used GigU, which automatically takes a screenshot of each offer as it appears, making the extraction process much easier.
Whichever method is used:
Start with trip 1 and preserve the exact sequence.
Save the offer time whenever possible.
Do not keep only the obviously good or bad screenshots.
Keep expired, declined, Exclusive, and matched offers.
Store reservation offers separately from immediate requests.
Remove or blur passenger names and precise addresses before sharing the data publicly.
Selective screenshots create selective data. The experiment works only when the boring middle of the market is captured along with the memorable extremes.
Extract the visible information.
Each spreadsheet row should represent one offer and include:
Sequential offer number
Time received
Upfront fare
Passenger rating
Pickup minutes
Pickup miles
Passenger-trip minutes
Passenger-trip miles
Product type
Exclusive or Trip Radar/matched status
Verified, VIP, and Rarely Cancels labels
Multi-Stop
Airport or priority-queue status
Reservation
Surge, Priority Pickup, Flash, or Pro payment
General pickup and destination zone, if visible and safe to retain
Accepted, declined, expired, or unsuccessfully matched
For completed trips, add a second group of fields:
Actual pickup and trip duration
Actual mileage
Actual passenger wait time
Final fare
Tip
Cancellation or no-show payment
Return or repositioning mileage
Minutes until the next accepted trip
The distinction between offered and completed data must remain visible. Do not put unearned tips into the expected value of an offer unless actual trip history supports the estimate.
Use an LLM—but verify the extraction.
An LLM can read the sequential screenshots and convert the visible fields into a spreadsheet. A useful extraction instruction is:
Read these Uber offer screenshots in the order of their filenames. Create one row per screenshot. Extract only information that is visibly present. Do not infer missing mileage, badges, locations, or trip types. Use blank cells for missing fields. Return a CSV with these columns: Offer Number, Time, Fare, Rating, Pickup Minutes, Pickup Miles, Trip Minutes, Trip Miles, Product, Exclusive, Verified, VIP, Rarely Cancels, Multi-Stop, Airport, Reservation, Priority, Flash, Pro Perk, Pickup Zone, Destination Zone, and Notes.
AI extraction is not the final quality check. It can confuse a 3 with an 8, miss a decimal point, merge two durations, or interpret a badge incorrectly.
At minimum:
Manually verify a random 10% of the screenshots.
Verify every offer appearing in the best and worst groups.
Verify every extreme fare, duration, or mileage value.
Check that pickup plus trip time equals total time.
Check that pickup plus trip mileage equals total mileage.
Check for repeated screenshots or likely reoffers.
Leave unreadable values blank rather than guessing.
Calculate the four essential measures.
For every trip offer, calculate:
Total minutes = pickup minutes + passenger-trip minutes
Total miles = pickup miles + passenger-trip miles
Gross revenue per hour = fare ÷ total minutes × 60
Gross revenue per mile = fare ÷ total miles
Then add the driver’s vehicle cost:
Estimated vehicle cost = cost per mile × total miles
Estimated profit = fare − estimated vehicle cost
Estimated profit per active hour = estimated profit ÷ total minutes × 60
Both gross revenue per mile and gross revenue per hour are necessary. A trip can pass one test and fail the other.
A high-mile highway trip may look acceptable by the hour but create too much vehicle cost.
A low-mile trip in traffic may look excellent by the mile but consume too much time.
Estimate a personal vehicle cost.
GigU has a calculator to help calculate vehicle cost. A driver can also build a starting estimate from:
Energy or fuel per mile
Gas price ÷ miles per gallon, or
Electricity price × kilowatt-hours per mile
Maintenance per mile
Expected tires, brakes, fluids, repairs, and other mileage-related maintenance ÷ expected miles
Depreciation per mile
Expected vehicle value lost during ownership ÷ miles driven during that period.
The result should reflect the purpose of the calculation. A direct variable-cost estimate is useful for deciding whether one additional trip is worth taking. A full business cost estimate should also account for insurance, financing, registration, cleaning, taxes, and the cost of owning the vehicle when it is not in motion.
Drivers should test more than one assumption. If a trip works at $0.20 per mile but fails at $0.50, it is sensitive to vehicle cost and deserves more scrutiny.
Build red, yellow, and green zones.
After 100 or more trip offers, sort the spreadsheet separately by revenue per total mile, gross revenue per active hour, and estimated profit per active hour.
Then establish three zones.
Red: normally decline
The offer falls below the driver’s hard minimum on time, mileage, or estimated profit. Accept only for a specific nonfinancial reason, such as reaching home or repositioning to a planned destination.
Yellow: conditional
The offer clears the hard minimum but does not meet the preferred standard. Consider:
Destination and likelihood of a return trip
Current demand and expected waiting
Exclusive certainty versus an uncertain match
Passenger rating and personal risk tolerance
Multi-stop or reservation risk
Whether the trip advances a personal destination
Green: normally accept
The offer clears the preferred thresholds for both time and mileage and does not contain an obvious destination or waiting problem.
The two-threshold requirement matters. A green trip should not merely pay well per mile while wasting time, or pay well per hour while consuming the vehicle.
An illustrative Syracuse starting point.
These numbers are examples from this dataset, not universal recommendations. With a $0.30-per-mile direct cost and an $18-per-hour active-profit target, the exact offer-level floor is: Fare must be at least $0.30 × total miles + $0.30 × total minutes
If GigU can evaluate estimated profit directly, a first version of the color zones could be:
Red: below $18 estimated profit per active hour
Yellow: $18–$22 estimated profit per active hour
Green: above $22 estimated profit per active hour
If GigU uses gross revenue thresholds, the driver should set both a time floor and a mileage floor. In this Syracuse sample, a $1-per-total-mile filter produced approximately $17.75 per observed shift hour in the chronological replay, while the $18 net-active-hour rule captured about 93% of the perfect-hindsight profit. Those results make $1 per total mile and roughly $25 or more in gross revenue per active hour reasonable values to test—not automatic national standards.
The final settings should come from the driver’s own cost, opportunity-cost wage, and offer distribution.
Enter the thresholds into GigU’s Cherry Picker Tool.
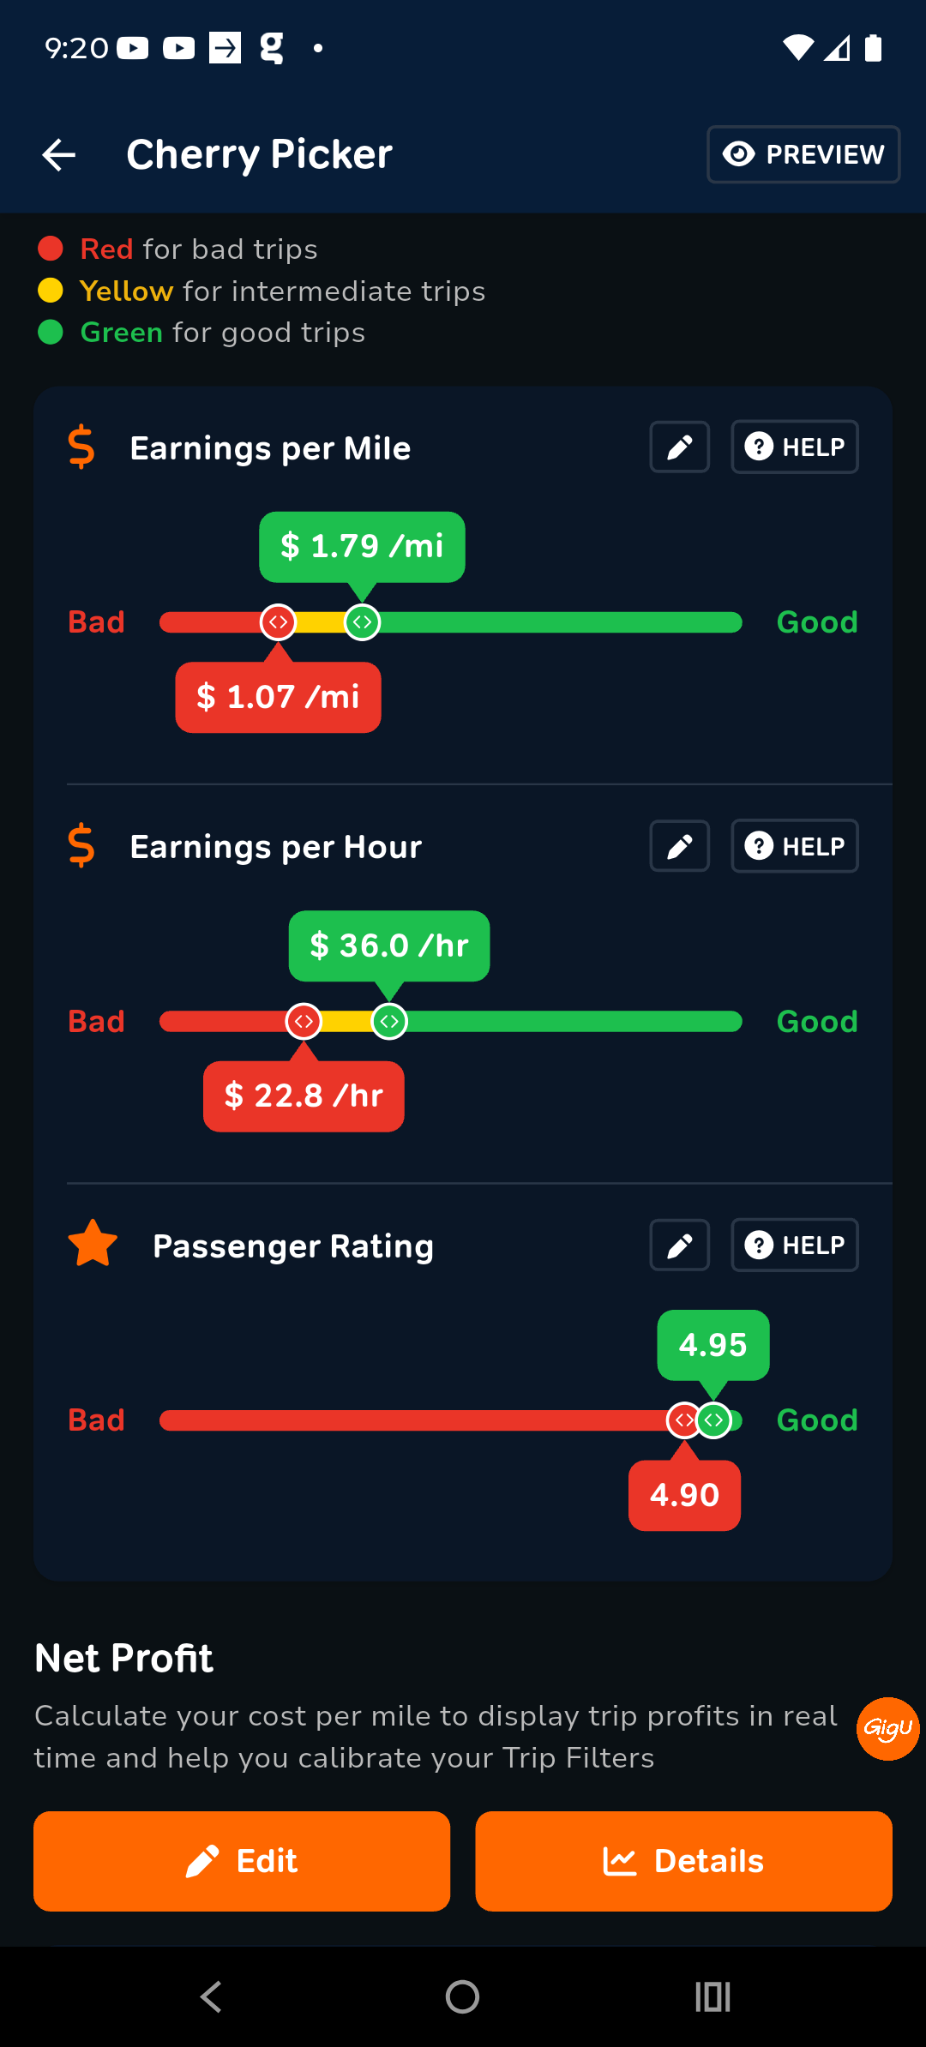
Once the red, yellow, and green boundaries are chosen, enter the revenue-per-mile, revenue-per-hour or revenue-per-minute, and vehicle-cost assumptions into GigU.
The app then becomes a real-time decision aid:
Red identifies offers below the hard floor.
Yellow identifies offers that require judgment.
Green identifies offers that normally deserve acceptance.
This moves the arithmetic out of the driver’s head and into a rule established while parked, calm, and able to study the evidence.
The thresholds should assist judgment, not replace it. GigU cannot know that a rural destination requires a 30-mile return, that a stop will take 20 minutes, or that the driver wants to go home in that direction unless those factors are included.
Validate and revise the settings.
Run the new thresholds for several normal shifts and record:
Total online hours
Active hours
Gross revenue
Total mileage
Estimated vehicle cost
Profit per active hour
Profit per online hour
Acceptance rate
Offers rejected that the driver later regretted
Green offers that produced bad real-world outcomes
The most important test is not whether every green trip was perfect. It is whether the complete strategy improved profit per online hour without creating unacceptable mileage, stress, or destination problems.
Update the thresholds when fuel or electricity prices change, the vehicle changes, Uber changes its pricing, or the driver moves to a different schedule or market. At minimum, repeat a shorter 50- to 100-offer audit every few months.
The goal is not to predict the next card. It is to decide, in advance, which cards are good enough to keep.
NOTE: GigU is a sponsor of my YouTube channel and masterclass. They did not pay for this project, nor did I consult with them on this exercise. But I’m extremely satisfied with using GigU’s app for this research. I think you will be too.
My Advice for Uber Drivers
1. Know your cost.
Estimate a real per-mile cost for your vehicle. An efficient paid-off hybrid and a financed luxury SUV should not use the same acceptance rule.
2. Set a minimum profit standard.
Use this formula: Required fare = cost per mile × total miles + desired profit per hour × total minutes ÷ 60
The target is more useful than trying to recognize the day’s single best trip.
3. Count the pickup.
Never evaluate only the passenger portion. Long pickups are where many attractive-looking fares become weak work.
4. Track online time.
Record when the app is on, not merely active time. A beautiful active-hour rate can hide an unproductive shift.
5. Treat badges as secondary information.
Verified, VIP, and Rarely Cancels did not predict higher pay or higher passenger ratings here. Use them for the limited information they provide, not as evidence that the fare is good.
6. Require compensation for uncertainty.
Long pickups, multi-stops, remote destinations, and non-guaranteed matches deserve a larger margin of safety.
7. Do not worship a fixed acceptance rate.
Acceptance rate is an outcome of your standards and the local supply of offers. It should not be the initial objective unless a specific benefit justifies the marginal trips required.
8. Reevaluate by market and time.
Syracuse at 2 p.m. is not Syracuse after a concert, and Syracuse is not Chicago, Miami, or Los Angeles. A driver needs a local operating strategy.
9. Multi-app!!!
I don’t multi-app. But I should. So this experiment did not test it. Multi-apping may reduce unpaid idle time by giving drivers more trips to choose from, but drivers should assess whether it actually improves total profit after accounting for mileage, repositioning, and downtime.
What Uber passengers should understand
When a driver declines a request, it does not necessarily mean the driver dislikes the passenger or destination. The trip may require ten unpaid miles to reach a three-mile passenger ride. The fare may not cover the time and vehicle use at a competitive rate. Passengers can make requests easier to accept by:
Maintaining a high rating
Being ready when the driver arrives
Choosing a safe, legal, accessible pickup point
Adding stops in the app before the trip
Avoiding open-ended stops
Recognizing that remote pickups and destinations create unpaid repositioning risk
A Verified or VIP label does not pay the driver. Readiness and respect for the driver’s time have direct operational value.
What I would ask Uber to change
Let drivers set their rates in the Uber app.
This would be the one fix. If I could enter the exact parameters of the trips I am willing to accept, I would not have to calculate profitability while driving. Trips that fail my standards would not need to be shown to me.
Show driver-defined profitability.
Another solution is to show drivers the numbers. Let drivers enter their own per-mile cost and desired hourly profit. Then show the estimated profit per hour and per mile in the offer, not merely the gross revenue.
Pay adequately for pickup work.
The data suggest that pickup work is valued less than passenger-carrying work. If Uber needs drivers to serve distant passengers, long-pickup compensation must preserve a reasonable hourly return.
Make multi-stop compensation explicit.
Show the expected stop time, the unpaid grace period, and the exact waiting rate before acceptance. Consider guaranteeing a minimum stop payment. And start the wait timer when we arrive, not allowing a 2-minute “free” grace period.
Reduce unsafe decision pressure.
Simplify the moving-vehicle offer screen, extend the response window where possible, or provide a driver-defined auto-accept filter based on time, mileage, destination, rating, and profitability.
Get rid of the badges OR make the badges worth something.
The badges didn’t equate to value. If they do, tell us exactly what Verified, VIP, and Rarely Cancels mean to us, how recently the status was determined, and whether the label changes assignment, safety procedures, or pay.
NOTE: The best badge ever was the Lyft badge that showed how often the passenger tipped. That was the best feature ever on any gig app!
Give drivers their own data.
Provide easy access to downloadable trip offer history, including declined and expired offers, not merely completed-trip history. Independent contractors should be able to analyze the opportunities their businesses were offered.
What this experiment does not prove.
This study does not prove:
Uber’s intent when designing the offer screen
Uber’s profit or take rate
The rider’s price
A universal fare formula
A universal acceptance-rate target
Whether Verified passengers are safer
Whether high-rated passengers tip more
Which neighborhoods are universally good or bad
What the same driver would have earned if the trips were actually accepted
The final point matters. Accepting a trip changes the driver’s location and future offer stream. The chronological replay keeps the recorded stream constant, allowing strategies to be compared. It is a controlled counterfactual, not a prediction of an alternate reality.
Conclusion
Uber driving looks simple from the passenger seat. A request appears, a driver accepts, and a car arrives.
From the driver’s seat, every request is a short-lived investment decision. The driver commits time, mileage, vehicle value, and the opportunity to receive other work. The decision must often be made in roughly 15-seconds without knowing what comes next.
In this experiment, the best quarter of offers paid approximately twice as much per active hour as the worst quarter. But taking only the absolute best offers left too much unpaid time. Accepting nearly everything kept the driver busy at the cost of lower-quality work. The strongest strategy was neither blind acceptance nor endless rejection. It was disciplined selectivity: know the cost, count the pickup, set a standard, and accept good work without waiting forever for perfection.
The public should understand why drivers decline. Drivers should understand why active hourly rates can mislead them. And Uber should recognize that genuine transparency requires more than displaying a fare.
The pay offered in this experiment was remarkably inconsistent relative to the complexity of the decisions drivers were required to make.
Uber has the data.
The driver should not have to gamble.
Methodology Summary
Market: Syracuse, New York
Date: Wednesday, August 5, 2026
Observation period: 12:49 p.m.–5:48 p.m.
Recorded offers: 223
Primary live-offer pool: 220 after excluding three reservations
Chronological replay: 222 offers after excluding the anomalous 4:50 p.m. Comfort Reservation
Direct variable vehicle cost: $0.30 per total mile
Active time: Pickup minutes plus passenger-trip minutes
Profit: Upfront driver fare minus direct variable mileage cost
Tips and completed-trip adjustments: Not available
Primary limitation: Offers were observed, not completed; accepting trips would have changed location and future offers