Uber Algorithm: 159 Identical Rides, 159 Prices - An Uber Driver Analysis
Out of 159 identical Ubers, some passengers paid less than $80, while others paid more than $250.
Same route. Same car. Same driver. Different prices. Why?
I want to explain Uber’s hidden pricing algorithm and what it really means for riders, drivers, and even Uber.
My name’s Levi. I’ve completed over 14,000 Uber trips in the last five years. Before I started driving full-time, I was an accountant and economist.
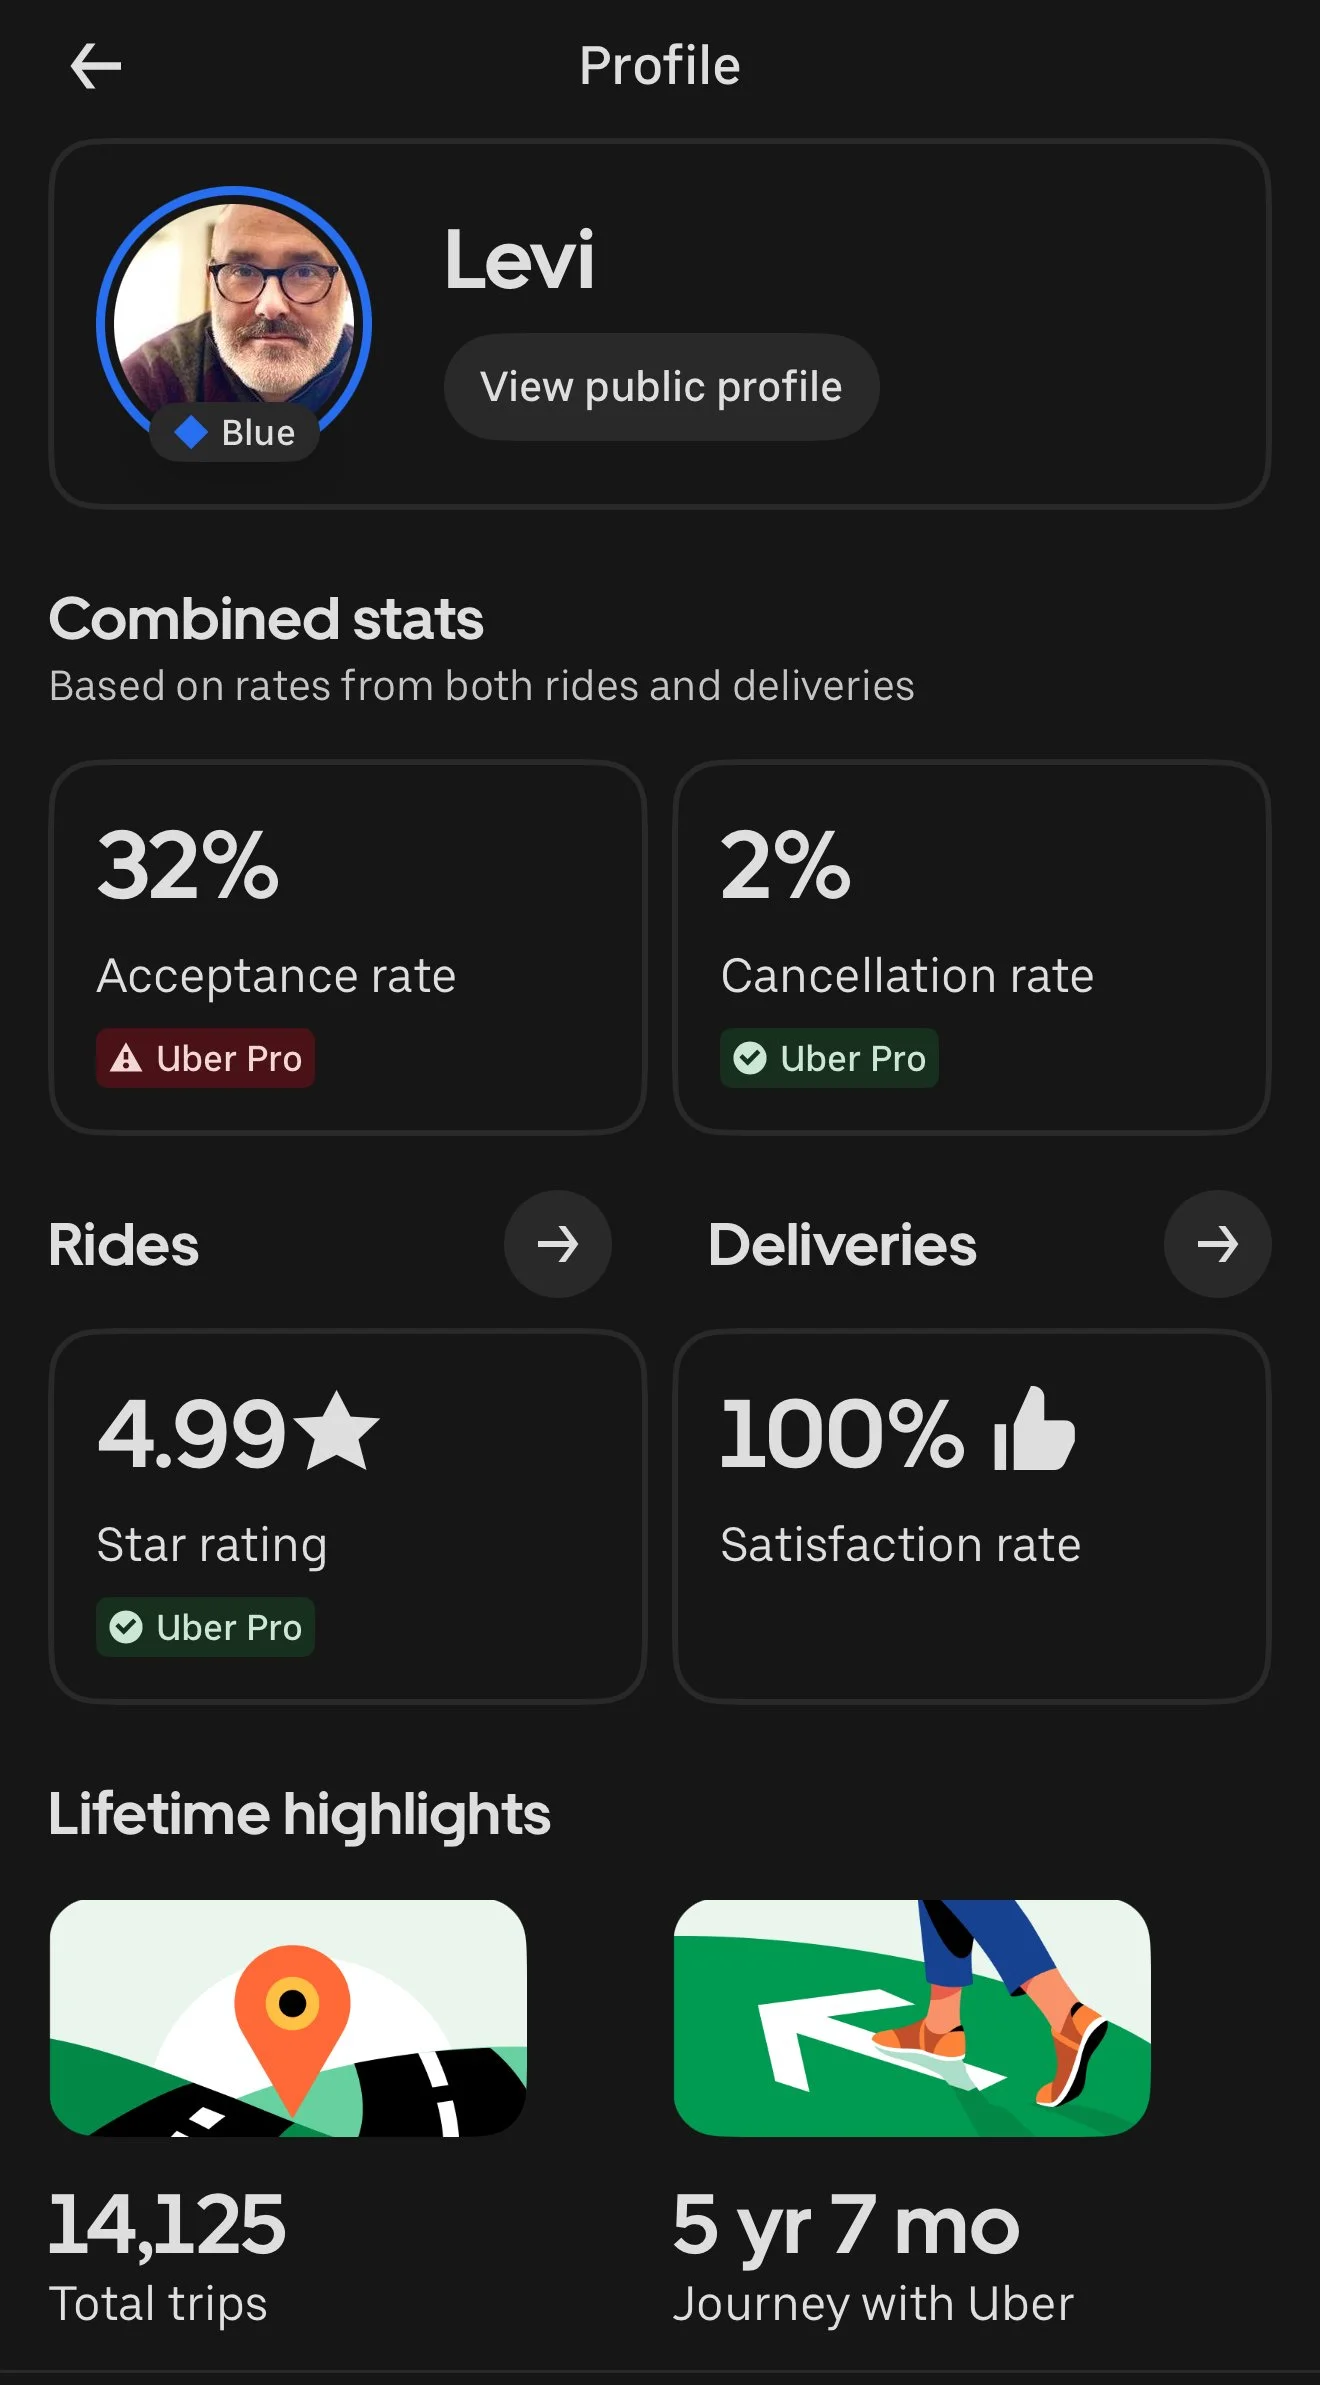
My Uber Profile
I’ve always wondered why Uber charges what it charges and pays what it pays. So, I combed through every Uber ride I’ve taken over the past two years and found 159 Uber trips from Ithaca to Syracuse Airport; not Syracuse to Ithaca, or city to city, just Ithaca to Syracuse Airport. I then narrowed it down to 129 identical trips, for which I had all the necessary data, including passenger payments and Uber fees.
Clean data to analyze!
Each of the 129 trips was approximately 62 miles long, taking about 1 hour and 15 minutes, with the exact same Tesla, the same route, and the same driver. And yet, nothing about the pricing was consistent. I even adjusted the data for trip type, tips, promotions, and adjustments, and then I started digging.
Here’s a link to the spreadsheet and a link to all the Uber trips if you want to analyze it yourself.
UberX vs. Comfort: Same Trip, Different Prices and Payouts
Across these 129 trips, 95 were UberX and 34 were Uber Comfort. As expected, Comfort rides cost passengers more on average, but I didn’t necessarily earn proportionally more.
Average UberX trip:
The passenger paid ≈ $119
I earned ≈ $60
Tax and Fees ≈ $14
Uber took ≈ $45
Average Comfort trip:
The passenger paid ≈ $139
I earned ≈ $69
Tax and Fees ≈ $16
Uber took ≈ $54
That means Comfort riders paid about 17% more, yet I only earned about 15% more. While Uber’s take on Comfort rides increased by 20%. Obviously, the only reason these trips qualified as Comfort was because of my Tesla, not because Uber provided any additional service. Comfort fares also had a higher starting point: the lowest Comfort fare was $110, compared to $80 for UberX, which offered the same car, driver, and route.
Uber’s take-rate averaged about 38% on UberX and 39% on Comfort, showing that Uber pockets a slightly larger percentage of higher-tier rides, even though their own service doesn’t change between the two categories.
Interestingly, UberX riders tipped 71% of the time, which is higher than the 59% of Comfort passengers. However, when Comfort passengers tipped, they tipped $27, or 21% of the price after promotions, versus UberX passengers, who tipped $21, or 20% of the cost after promotions.
No Clear Pattern: When Price Has Nothing to Do With Time
I expected to see predictable surge patterns: morning airport rushes, weekend spikes, maybe Friday nights. But the data told another story.
Fares jumped randomly. Logically, some of the most expensive trips happened at 2 a.m. However, other early-morning rides were among the cheapest. Mid-afternoon trips sometimes spiked; others didn’t.
Plotting time of day against fare showed no consistent trend, no steady surge, no linear relationship. Even on weekdays, the differences were minor: weekends were only slightly higher than mid-week, but prices bounced up and down with no apparent reason. If I had more data points, I could see a trend.
Two passengers taking the same trip at nearly identical times might pay twice as much, suggesting that Uber’s “upfront pricing” algorithm isn’t just reacting to demand, but also predicting what each rider is willing to pay.
This kind of price personalization means the algorithm doesn’t simply measure traffic or driver supply; it estimates your willingness to pay and charges accordingly.
The Mystery of the “Commercial Insurance” Fee
Each of the 129 trips I analyzed included a line item labeled “Estimated commercial auto insurance and operational expenses.”
Uber describes this as a booking fee that helps cover direct costs and insurance. It’s supposed to reflect the miles and duration of a specific trip, but in practice, it fluctuated wildly. And honestly, other than credit card processing fees, I don’t know what variable direct costs Uber has for each trip any way; isn’t the idea of a SaaS business is that almost all costs are fixed (overhead).
On these identical trips from Ithaca to Syracuse, the Uber commercial insurance fee ranged from $13.75 to $50.00. Same distance. Same route. Same car. Different costs.
There was no correlation between the trip’s distance or duration and the insurance charge. In some cases, Uber appeared to treat this line item as a variable lever, raising it on specific trips without explanation. On the $256 ride, this fee was $38.69; on one of the cheapest rides, it was $13.75.
To further make this point, over the past month, I took other extremely long Uber trips:
9/19 - 109 miles - $42 commercial auto insurance
9/20 - 262 miles - $50 commercial auto insurance
9/21 - 181 miles - $50 commercial auto insurance
10/13 - 257 miles - $38 commercial auto insurance
Uber says these funds are used to cover overall insurance and operational expenses, not tied to individual trips. Absolutely. The data shows that Uber can and does arbitrarily adjust this fee.
That means when Uber wants to take a larger cut, it can quietly increase this “insurance” charge, a cost neither riders nor drivers can question or verify.
Profit Per Mile: Who Really Earns What
When you break everything down by the mile, Uber’s imbalance becomes even clearer. Each Ithaca to Syracuse trip averaged about 62 miles, making it easy to see precisely who profits most from each mile driven.
UberX
For UberX, the average passenger paid $1.92 per mile before promotions and tips. Here’s where that dollar and ninety-two cents went:
$0.66 — paid to the driver as profit before taxes
$0.30 — my Tesla Y operating cost (fuel, maintenance, depreciation, etc.)
$0.24 — went to taxes, surcharges, and government fees
$0.72 — kept by Uber (I include commercial insurance only because Uber doesn’t have a transparent cost structure)
After accounting for vehicle costs, the driver’s actual profit is roughly $0.66 per mile. Uber, on the other hand, retains a larger portion of the payment for their expenses, which essentially amounts to the same mileage without driving, fueling, or maintaining the car.
While the driver bears 100% of the operational risk, Uber earns revenue per mile.
Uber Comfort
For Comfort, the average passenger paid $2.25 per mile, only $0.32 more per mile than UberX. Here’s how that breaks down:
$0.81 — paid to the driver as a profit before taxes
$0.30 — my Tesla Y operating cost (fuel, maintenance, depreciation, etc.)
$0.26 — went to taxes, surcharges, and government fees
$0.88 — kept by Uber, which includes commercial auto insurance
So even though the passenger pays 17% more for Comfort, Uber’s portion increases by more than 20% and the driver’s portion increases by only 15%.
In other words, Uber is generating more revenue for Comfort without providing any additional service.
It’s a quiet shift, hidden in the math: while the car, driver, and experience stay the same, Uber’s algorithm ensures that every extra dollar a rider spends yields an even bigger percentage for the company, regardless of the value the company provides.
Service Fees and Uber’s Expanding Cut
Historically, Uber claimed a 25% commission or “take rate”. Today, that number is essentially meaningless.
In this dataset, Uber’s effective take rate—the share of the total passenger fare that Uber retained—ranged from 21% to nearly 66%, before promotions, tips, and adjustments, averaging around 39%.
Some trips even showed negative service fees after, where Uber lost money due to fare adjustments and promotions. But those were rare outliers.
More often, Uber’s take exceeded 45%, and topped 50% on 13 trips.
Analysis of Uber’s 2024 financial reports cite a global take rate around 27%. That may be true on paper, but drivers’ real-world numbers tell a different story.
My own 2024 Uber tax summary shows:
Uber Service Fees for 3,528 trips = $31,543
Gross trip payments by passengers before tips = $74,564 + ~$3,500 Uber bonuses
That’s roughly 40% taken directly by Uber. In short, Uber’s slice of each fare has quietly crept up to around 35 – 55%, especially on long-distance Comfort routes where the driver’s pay doesn’t scale proportionally.
Deep Dive Q&A: What the Data Reveals About Uber’s Algorithm
How does Uber estimate the price to the passenger?
Uber uses “upfront pricing”, which predicts what a rider will likely pay based on multiple factors beyond just time and distance. These include:
Historical demand at that pickup location and time.
Driver availability in nearby zones.
Forecasted completion time based on real-time traffic.
The rider’s historical behavior and likelihood to accept higher prices.
My 129 identical trips show this clearly: the price doesn’t consistently align with duration or distance. Instead, Uber’s algorithm appears to be testing willingness to pay, often charging two riders vastly different fares for the same route.
How does Uber estimate the payment to the driver?
Driver pay is determined by Uber’s upfront driver fare model, which uses its own internal estimate of distance and time, not the rider’s price, to calculate your pay before the trip begins.
For these Ithaca–Syracuse rides, my pay averaged:
• $60 on UberX
• $69 on Comfort
Uber utilizes an undisclosed “earnings estimator” that factors in base fare, per-mile, and per-minute rates, as well as specific trip bonuses such as reservation fees or surge pricing. But because Uber’s system no longer directly ties rider fare to driver pay, the link between what the rider pays and what the driver earns has broken, creating the significant discrepancies I found.
How does Uber estimate its service fee?
Uber’s service fee is the flexible difference between what the rider pays and what the driver earns, minus third-party taxes and surcharges.
Unlike traditional commission models, this fee is not a fixed amount.
In my dataset:
Uber’s take ranged from 23% to 59%, averaging 40% overall.
The range widened most on Comfort rides, where Uber consistently captured a slightly higher percentage.
Uber likely adjusts the service fee dynamically to balance short-term profitability and “market testing,” which is why no consistent formula explains the variation.
How does Uber estimate the commercial insurance rate?
The “Estimated Commercial Auto Insurance and Operational Expenses” fee is included in the fare presented to riders.
In theory, this covers Uber’s nationwide insurance and platform costs. Still, according to my data, the amount fluctuated from $13.75 to $50.00, even though the route, driver, and car remained constant.
Uber appears to use this line item as a pricing buffer, adjusting it to fine-tune total rider fares or absorb cost changes behind the scenes. It’s not based on individual trip risk, as Uber’s own receipts confirm that this fee “does not reflect insurance expenses incurred on individual trips.”
Does the season, month, day, or time of year affect the price?
Only slightly and inconsistently.
I found no strong correlation between seasonality or time of day and rider price.
A few patterns emerged:
Early morning airport runs (4–6 a.m.) sometimes commanded higher fares, but not reliably.
Mid-afternoon rides occasionally surged, though others at the same time did not.
There was no recurring weekday vs. weekend premium.
This supports the theory that Uber’s algorithm prioritizes micro-level testing over consistent surge pricing cycles, especially on predictable routes such as airports.
Does the trip type matter?
Yes! But not in the way most people think. Comfort rides consistently cost more for passengers, but didn’t yield proportionally higher driver earnings.
UberX passengers paid less but gave roughly the same tips and often generated a better profit-to-mile ratio for me.
The data suggests Comfort’s higher price benefits Uber more than drivers.
Does trip duration or distance matter?
Kinda, but not in a linear way. While base pay is calculated from estimated time and distance, Uber’s algorithm doesn’t apply the same multiplier to every trip.
Two 62-mile UberX rides with identical durations could differ in passenger price by more than 100% regardless of surge. In short, distance affects the baseline, but the real variable is Uber’s hidden dynamic pricing layer.
Do specific trips tip better?
Yes. But not enough to offset Uber’s price inconsistencies. Across my 129 trips, Comfort passengers tipped slightly more per trip, but UberX riders tipped more often.
In particular:
Morning airport rides (5–8 a.m.) yielded the highest tip rates.
Late-night passenger rides had higher variance, with some passengers being generous and others not.
Tip frequency didn’t correlate to passenger price, which means riders paying more weren’t necessarily tipping more.
Does Uber’s take rate on this route align with its 2024 average?
Not quite. Uber’s 2024 average take rate was approximately 28–29%, or 21% after accounting for insurance adjustments.
My Ithaca–Syracuse route showed a 40% average take rate, roughly one-third higher than Uber’s reported figure in my 2024 taxes. I believe Uber is using longer trips to offset the cost of shorter trips.
Recommendations
Recommendations For Drivers:
Drivers: take only profitable trips! Know your cost per mile!
Track your earnings per hour and per mile, not per trip. This removes surge illusions and reveals true profitability.
Know how much a trip typically pays. Avoid taking the lower-paying trips by waiting for the same trip to be offered at a higher price.
Prioritize passengers, routes, and hours with higher tip frequency; early mornings outperform evenings in my data.
Recommendations For Passengers:
Check the same route multiple times a day and multiple times per app before booking, as prices can fluctuate dramatically without changes in demand.
If price matters, consider using UberX instead of Uber Comfort: it’s cheaper and usually the same car. Check the vehicle and driver on the way to pick you up to verify quality. Don’t be afraid to cancel if the car or driver doesn’t meet your standards; another driver will be ready.
Recommendations For Uber:
Transparency builds trust. If Uber publicly explained how fees and insurance are calculated, drivers and riders would engage more confidently.
Uber needs to shift from a pricing gimmick app to a legit transportation company. Right now, Uber is using an AI algorithm to manipulate drivers and riders. Uber is making money like a betting, dating or gaming app. And in the near future, this won’t be an advantage becuase drivers and riders will also be using their own AI algorithm to negotiate.
A consistent per-mile model could stabilize fares and restore the perception of fairness.
Dynamic pricing could remain, but without obscuring where each dollar actually goes.
The Takeaway: Hidden Complexity, Real-World Impact
After analyzing 129 identical trips, here’s what’s clear:
Passengers aren’t paying consistent prices. I found that the same UberX ride can cost $79 or $167, and a Comfort ride $109 to $168 before promotions and tips.
Drivers aren’t earning consistent pay. Payouts vary wildly, often disconnected from passenger price.
Uber’s fees and insurance charges fluctuate without transparency.
Uber’s take-rate is far higher on longer trips than the company admits.
Uber’s algorithm doesn’t just respond to supply and demand; it experiments. It tests what each market, rider, and trip can bear. That’s why two passengers can sit in the same car, on the same road, paying vastly different amounts. It’s also why drivers feel squeezed even when fares rise: the system is designed so Uber captures more of the upside each year.
Uber’s algorithm may be sophisticated, but its effects are simple:
Passengers pay more.
Drivers earn less.
Uber wins either way.
If Uber truly wants to build trust, transparency must come first. Until then, data like this will continue to tell the real story: one trip, one mile, one spreadsheet at a time.